
A beginner's guide to commercial real estate underwriting, using a hypothetical mixed-use acquisition in Cygnus DealLens.
Buying your first commercial property can feel deceptively simple. You find a building, look at the asking price, estimate the rent, talk to a lender, and decide whether the numbers seem comfortable.
That is also how inexperienced investors can talk themselves into very expensive mistakes.
Commercial real estate is less about finding a property you like and more about understanding how purchase price, income, operating expenses, vacancy, financing, and investor returns interact. A strong-looking number in one part of the deal can be offset by weakness somewhere else.
The central lesson
A good commercial real estate deal is not one good number. The goal of underwriting is to understand how the numbers work together, where the deal is strong, where it is vulnerable, and which assumptions deserve more investigation.
Meet the Example: Boardman Mixed-Use
To make those ideas concrete, let's walk through a hypothetical 14-unit mixed-use acquisition called Boardman Mixed-Use. The example comes from the learning sample set in Cygnus DealLens, so the figures below mirror what the app actually calculates and displays. To follow along with the lesson using the app, download it here: Cygnus DealLens - Apps on Google Play
The purchase price is $3.85 million. The scenario includes $88,000 in closing costs, $625,000 allocated to land, $180,000 in capital improvements, and a 31,000-square-foot building. It is modeled at 100% physical occupancy.
On the income side, the property has $470,000 in annual gross rent, $26,000 in CAM income or reimbursements, and $12,000 in other income. Financing is modeled at 70% loan-to-value, a 6.55% interest rate, and 25-year amortization, with a 6% vacancy allowance used in the underwriting.
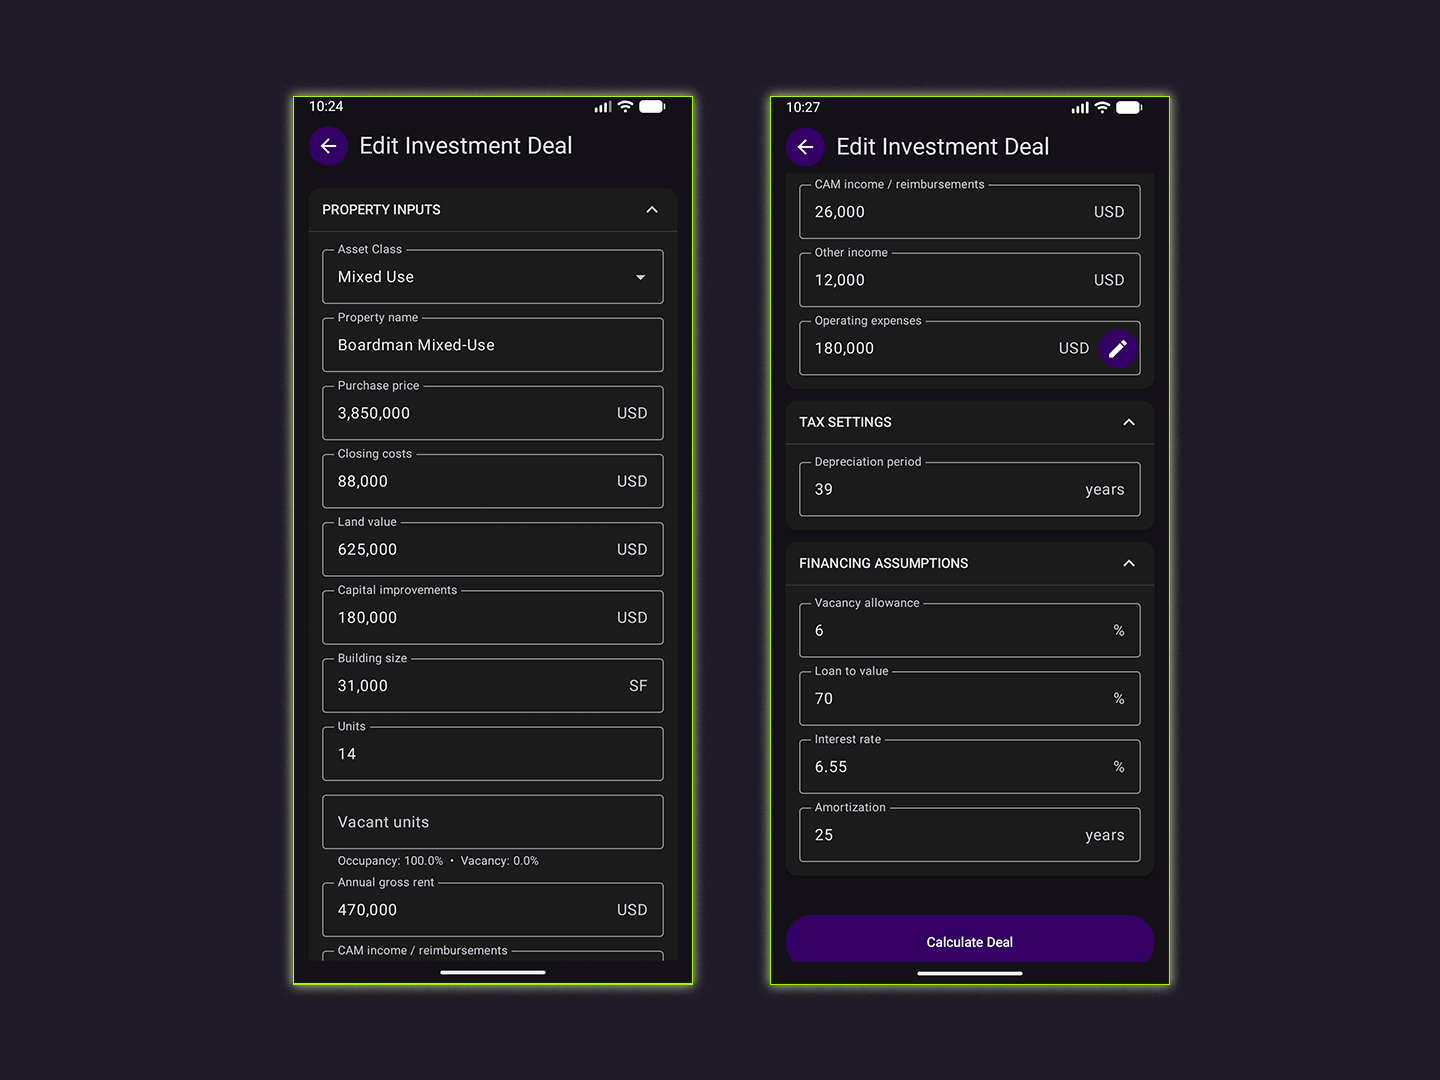
Figure 1. DealLens organizes the acquisition, income, tax, vacancy, and financing assumptions before calculating the deal.
Income Is Not the Same as Profit
One of the first habits a new investor should develop is to stop asking only, “How much rent does the property collect?” Gross rent is the top of the funnel. What matters is how much income survives vacancy and operating costs.
In Boardman Mixed-Use, the app applies the 6% vacancy allowance to the $470,000 gross rent, then adds CAM reimbursements and other income. That produces effective gross income of $479,800.
This distinction is important. The property may be physically 100% occupied today, but an investor can still choose to underwrite a normal vacancy allowance rather than assume perfect occupancy forever. Physical occupancy describes today; vacancy allowance is an underwriting assumption about the future.
Operating Expenses Are Where the Story Gets Real
The scenario includes $180,000 in annual operating expenses. That is not one mystery number. DealLens breaks it into the categories that actually consume property income: taxes, insurance, repairs and maintenance, utilities, janitorial, landscaping, snow removal, management, professional fees, reserves, and other costs.
For a novice investor, this is a valuable discipline. A deal can look wonderful when expenses are treated casually. Underwriting becomes more useful when each expense can be questioned, supported, and compared with actual property history or market expectations.
Figure 2. The expense worksheet turns a single operating-expense assumption into specific categories that can be reviewed and challenged.
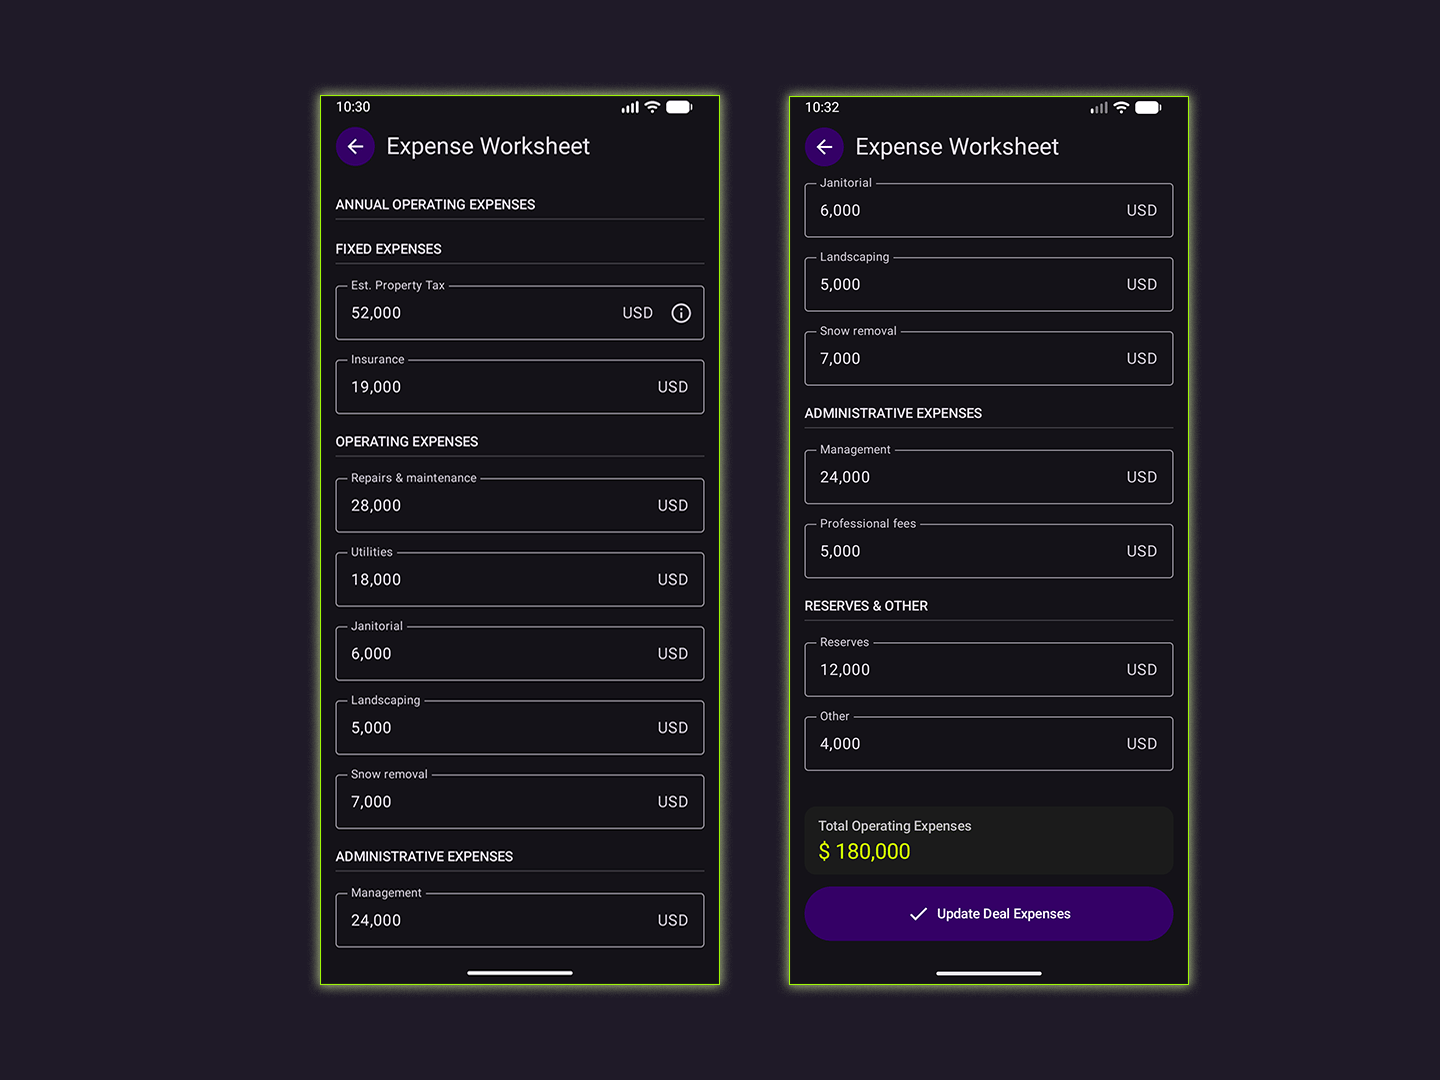
Subtracting the $180,000 of operating expenses from $479,800 of effective gross income produces net operating income, or NOI, of $299,800. The resulting NOI margin is about 62.5%.
Then Look at the Cap Rate, But Do Not Stop There
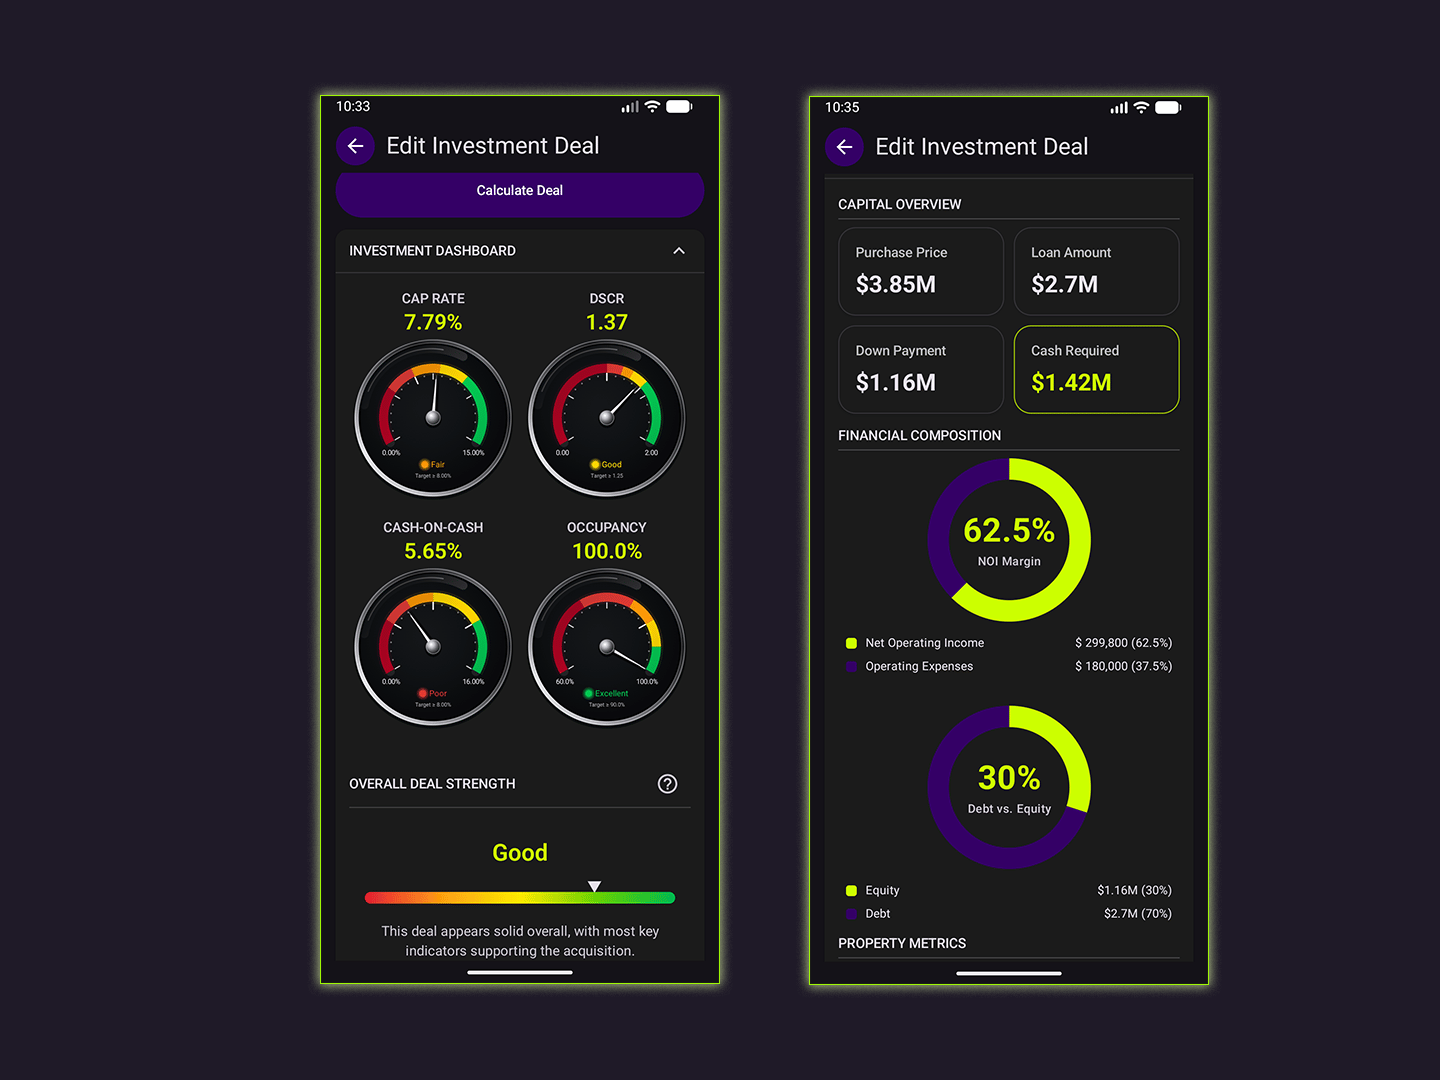
Cap rate is one of the most familiar measures in commercial real estate. In this scenario, $299,800 of NOI divided by the $3.85 million purchase price produces a 7.79% cap rate.
DealLens rates that cap rate as Fair under the assumptions used for this example. But the dashboard immediately shows why cap rate should not be treated as a verdict.
The debt service coverage ratio, or DSCR, is 1.37 and rates Good. Occupancy is 100% and rates Excellent. Cash-on-cash return is only 5.65% and rates Poor. Put together, the overall deal strength still lands at Good.
Figure 3. The dashboard shows the tension inside the deal: Fair cap rate, Good DSCR, Poor cash-on-cash return, Excellent occupancy, and an overall Good rating.
Why multiple metrics matter
A property can support its debt well and still deliver a weaker return on the investor's cash. It can be fully occupied and still be priced too aggressively. The point of using several measures is not to create more numbers. It is to see the deal from more than one angle.
Why Is the Cash-on-Cash Return Weak?
This is where the example becomes especially useful for a first-time investor. Boardman requires approximately $1.423 million in cash: a $1.155 million down payment plus $88,000 in closing costs and $180,000 in capital improvements.
After debt service, the property is projected to generate $80,427 in annual cash flow. Comparing that cash flow with the cash invested produces the 5.65% cash-on-cash return.
That does not automatically make the property bad. It tells us something more specific: under these assumptions, the investor is committing a large amount of cash relative to the annual cash flow being produced.
Can We Improve the Cash-on-Cash Return?
This is the moment when underwriting becomes more useful than simply labeling the deal. Instead of asking how to make the gauge turn green, ask what realistic changes could improve the relationship between cash invested and cash flow.
- Negotiate the acquisition price. If the same income can be acquired for less, the return profile can improve. A lower price can reduce the equity requirement, financing burden, or both.
- Improve the financing terms. A lower interest rate or a longer amortization period can reduce annual debt service and leave more NOI available as cash flow. More leverage is not automatically better; borrowing additional money at an expensive rate can increase risk without improving the return.
- Increase sustainable property income. The property is already modeled at full physical occupancy, so improvement would come from legitimate rent growth, lease escalations, better CAM recovery, or other supportable income rather than simply filling empty units.
- Review operating expenses carefully. Insurance, management, utilities, repairs, and other categories deserve scrutiny. The goal is to identify real efficiencies, not to lower assumptions artificially until the analysis looks attractive.
- Question the timing and purpose of capital improvements. The scenario includes $180,000 in improvements. If those costs are necessary, they belong in the analysis. If some can be phased, negotiated, credited by the seller, financed differently, or shown to create additional income, the investor should understand that before closing.
The important lesson is that a weak metric is not an invitation to manipulate the inputs. It is an invitation to investigate the deal. Sometimes the answer is a better price or better loan. Sometimes the property needs operational improvement. Sometimes the correct answer is that the investment simply does not meet your return objective.
Try to Break Your Own Deal
Once a scenario looks acceptable, make it less comfortable. Reduce income. Raise expenses. Increase the interest rate. Assume some vacancy. Ask what happens if planned improvements cost more than expected.
A strong investment should not depend on every assumption going perfectly. The question “What would have to happen for this deal to stop making sense?” is often more valuable than asking only how much money you might make.
Boardman provides one useful resilience measure: break-even occupancy of 78.62%. In other words, under the modeled assumptions the property does not need to remain at 100% occupancy merely to cover its operating expenses and debt service. That does not eliminate risk, but it gives the investor another way to understand the margin for error.
Move From Dashboard to Due Diligence
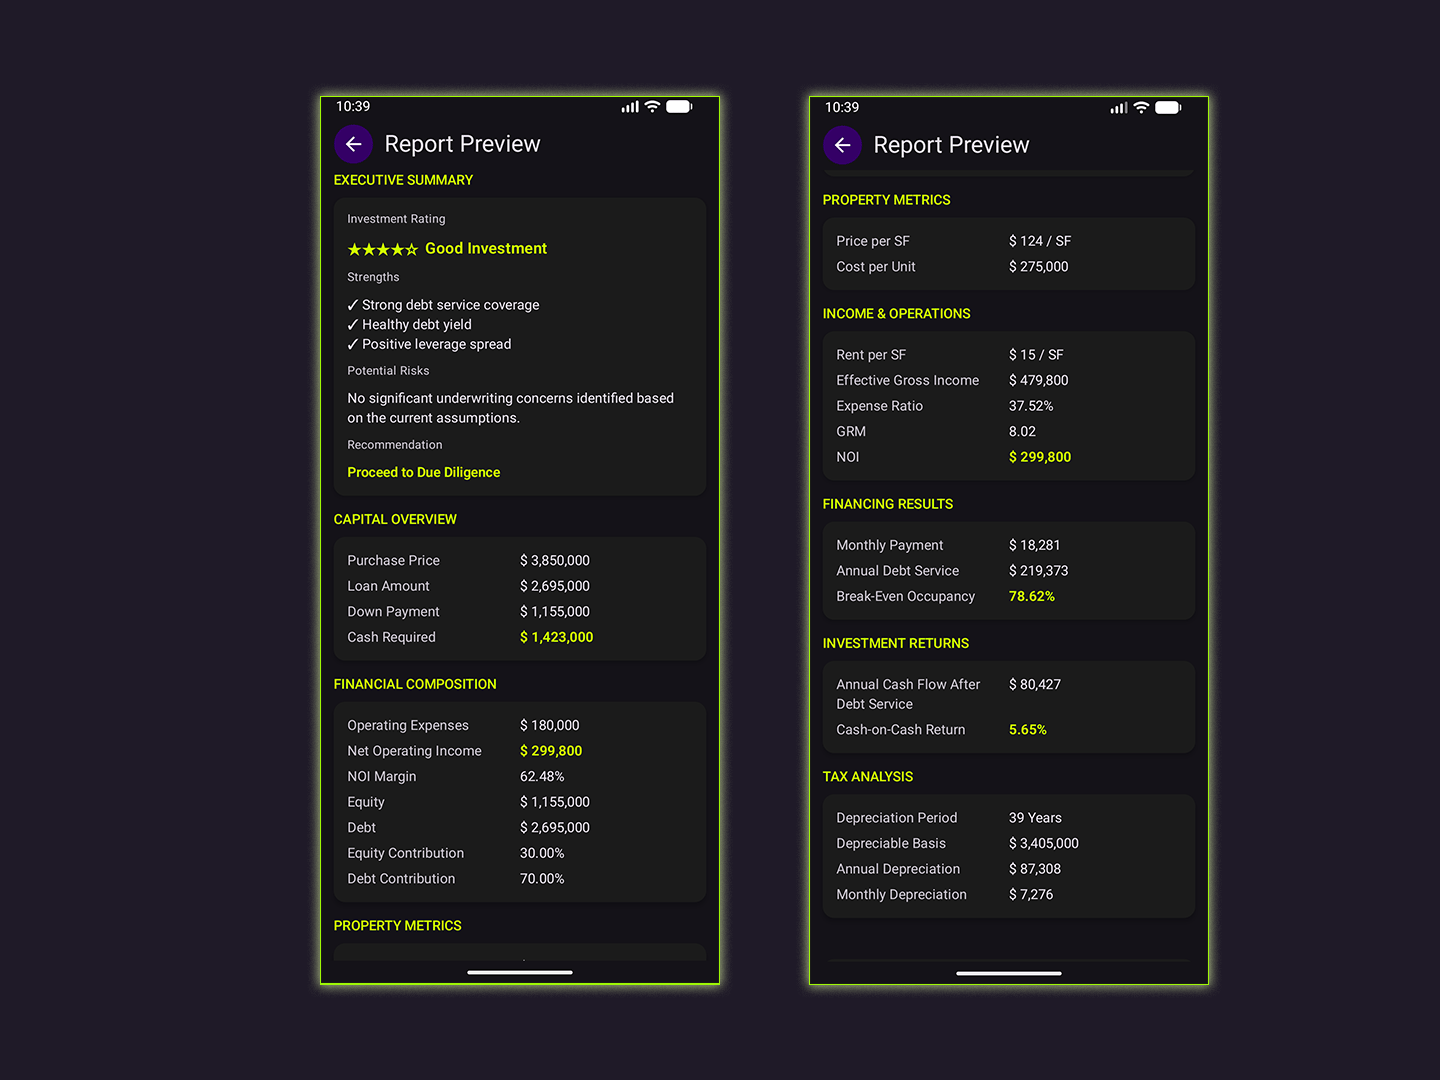
The report view pulls the individual calculations into a broader underwriting picture. Boardman shows $299,800 in NOI, a 37.52% expense ratio, $18,281 in monthly debt service, $219,373 in annual debt service, $80,427 in annual cash flow after debt service, and the same 5.65% cash-on-cash return.
DealLens summarizes the example as a Good Investment and recommends proceeding to due diligence. That wording matters. Underwriting should help decide whether a property deserves deeper investigation; it should not pretend to replace that investigation.
Figure 4. The report view consolidates the property, financing, return, break-even occupancy, and depreciation results into a due-diligence-ready summary.
Numbers Cannot Inspect a Roof
Every financial model has a boundary. A mathematically attractive return cannot tell you whether the roof is failing, a major tenant is preparing to leave, zoning conflicts with your plan, environmental issues are present, or market rents are weaker than the assumptions you entered.
Commercial real estate requires both quantitative and qualitative judgment. A tool can organize the quantitative side. The investor still needs leases, operating statements, inspections, market research, lender terms, legal review, tax advice, and professional judgment.
The quality of the answer is always tied to the quality of the assumptions.
Learn the Language by Working Through Deals
Commercial real estate can look intimidating because experienced investors speak in cap rates, DSCR, leverage, cash-on-cash returns, NOI, break-even occupancy, and expense ratios. Those terms become much easier to understand when you can see them respond to an actual property scenario.
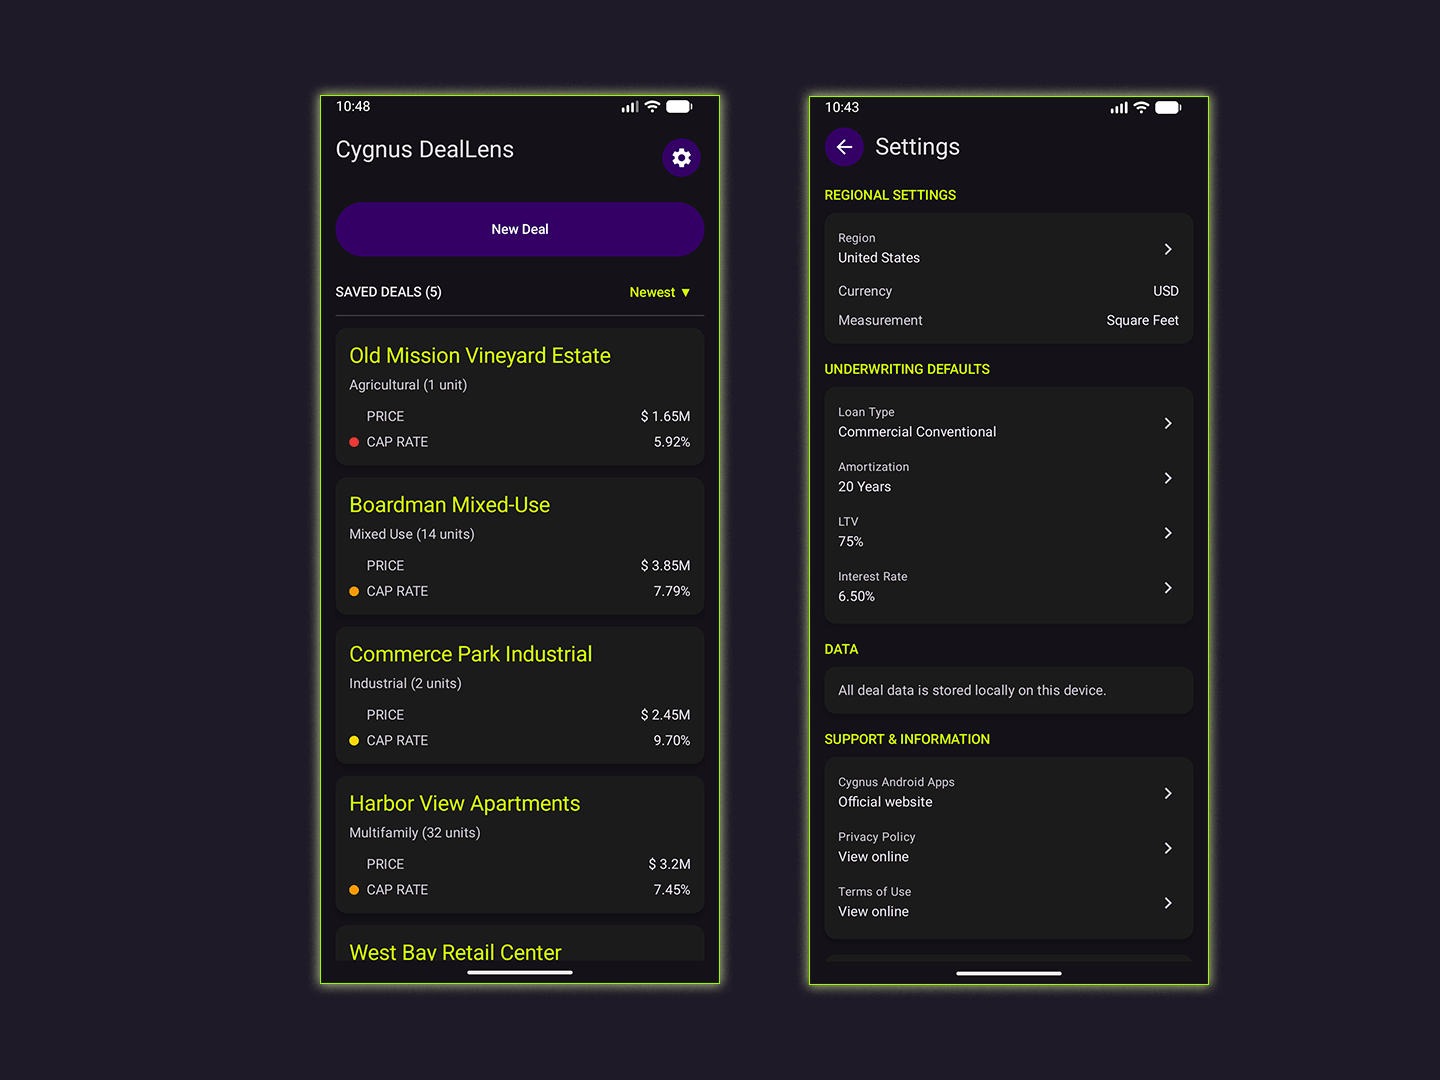
DealLens includes sample investments across different property types and lets the user establish regional and underwriting preferences. That makes it useful not only for analyzing a potential acquisition, but also for learning how changes in assumptions affect the results.
Figure 5. Saved learning examples and configurable underwriting defaults give newer investors a place to explore before modeling their own acquisition.
Your First Deal Does Not Need to Be a Guess
Underneath the terminology, commercial property investing comes back to a set of understandable questions. What does the property cost? How much cash will I have invested? How much income does it produce? What does it cost to operate? What will financing cost? What return remains? And what happens if my assumptions are wrong?
Learn to answer those questions consistently, and you are already developing the habits of a commercial real estate investor.
Cygnus DealLens is designed to support that process. It organizes the assumptions behind a potential acquisition, calculates professional underwriting metrics, and helps buyers examine a property through multiple financial lenses before making a major investment decision.
Explore Cygnus DealLens
Professional investment intelligence for evaluating commercial property acquisitions. Available for Android on Google Play.
Illustrative example only. DealLens supports analysis and professional judgment; it does not provide investment, legal, tax, accounting, or lending advice.
Download Today
Cygnus DealLens - Apps on Google Play